Is Your Power BI DAX Getting Too Long to Maintain?
Two hundred lines of CALCULATE and FILTER is not a sign of advanced DAX. It is usually a sign that the warehouse never gave you the keys, the history or the grain you needed.

The data warehouse automation platform trusted by data teams across industries









Does this sound familiar?
- A single measure has grown past a hundred lines and only one person understands it.
- Visuals take fifteen to forty five seconds, and it is always the same three measures.
- Changing one measure quietly breaks four visuals on another page.
- You are writing DAX to work out what a value was last March, not what it is now.
Long DAX is rarely a DAX problem. It is structure that was missing upstream, rebuilt at query time, on every click.
What the long measures are actually doing
- Reconstructing history.
CALCULATEwith date filters, standing in for a slowly changing dimension the warehouse never kept. - Bridging many to many. Iterators resolving a relationship that has no bridge table.
- Faking keys.
LOOKUPVALUEand concatenated text columns, because there is no surrogate key to join on. - Fixing grain.
SUMXover a filtered table, because the fact table holds two grains at once.
All four run per visual, per filter, per user. That is the fifteen to forty five seconds.
Why it lands on you
- Nobody chose this. Each measure was the shortest path to a working visual that week.
- The logic is invisible outside the
.pbix, so it cannot be reviewed or reused. - You can rewrite the measure. You cannot add the dimension it needs.
The work is in the wrong place
- History, keys, bridges and grain are warehouse work. In DAX they are rebuilt on every click.
- It belongs in one central place: a data warehouse or data hub, built once and read by every report.
- If that sounds expensive, the estimate probably assumes hand built pipelines. A specialised automation platform generates them from a model, which changes both the cost and the time it takes.
What changes when the model arrives finished
Datavault Builder generates the keys, history and grain in the warehouse itself, on SQL Server, Azure SQL, Synapse, Fabric, Snowflake, Databricks or BigQuery.
- Surrogate keys are explicit, so relationships are real and
LOOKUPVALUEdisappears. - Point in time tables answer “what did it look like in March” as a join, not a measure.
- Bridge tables resolve many to many before Power BI sees it.
- One grain per fact table, so
SUMmeans what it says. - Measures collapse to
SUM,AVERAGE,COUNT. Short enough that a colleague can review them.
What to ask for
“This measure is rebuilding history at query time because the dimension is not historised. Can we get a point in time table and proper surrogate keys in the warehouse, so the measure becomes a plain SUM?”
That names what is missing, rather than asking for the report to be faster.
See It Working on Your Own Data
Book a free demo and bring the report that gives you the most trouble.
Three Steps to Numbers That Add Up
-
Extract the existing logic
Collect the calculations, joins and filters that live in your reports today.
-
Centralize it in one place
The logic moves into the warehouse model once, so every report reads the same definition.
-
Enjoy numbers that add up
Every report shows the same figure, and “where did this number come from” has a visible answer.
How Datavault Builder Hands Your Report a Finished Model
-
The model arrives finished
Datavault Builder generates the vault and the star schema to run natively in the database you already have: SQL Server, Azure SQL, Synapse, Fabric, Snowflake, Databricks or BigQuery.
-
The work leaves the report
No merge, no parsing, no fuzzy match. That work is gone from the report.
-
Sources arrive integrated
Customers from the ERP, the CRM and the web shop are matched into one set of conformed dimensions. The join happens once in the warehouse, not again in every report.
-
History you can query
Every change is retained as it arrives, so you can report as-was as well as as-is, even where the source system overwrites its own records.
-
Every number has lineage
The logic gains lineage, so “where did this number come from” has a visible answer.
-
Changes handled upstream
Slowly changing dimensions are handled upstream as vault satellites, not approximated.
Customer Story: Porta
Recognized by BARC in The Data Fabric Survey 26
Meet Our Expert
Twenty minutes with our Sales Director, and an honest answer on whether this fits your situation.

Matt Collett
Sales Director
Great, pick a time that works for you:
Other Problems This Series Covers
-
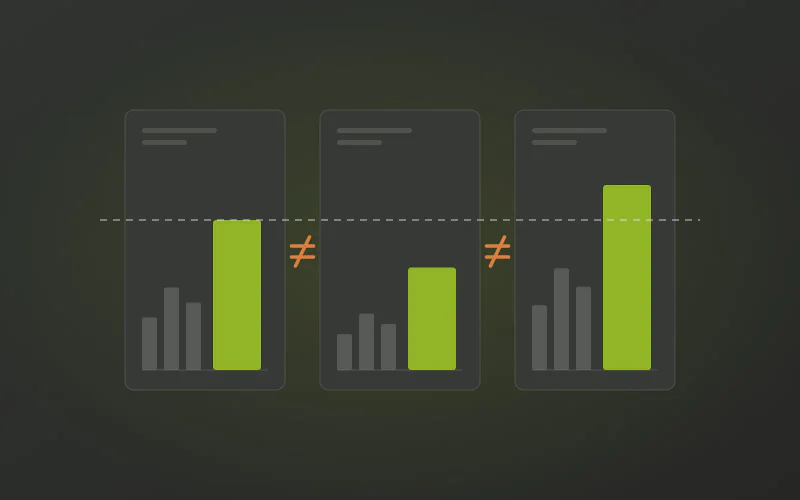
Do Your Power BI Reports Show Different Numbers for the Same Thing?
Finance, Sales and Operations each built their own semantic model, and each is internally consistent. The definitions were never wrong in one place. They were never agreed in any place.
-
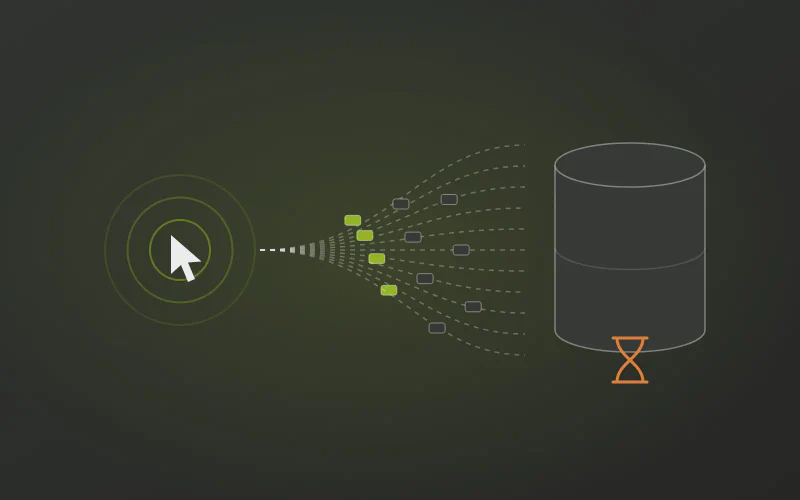
Is Your Power BI DirectQuery Report Slow on Every Click?
DirectQuery and Direct Lake promise live data. What you get is a thirty second visual and a compute bill nobody wants to explain. The mode is not the problem. The schema underneath it is.
-

Does Your Power BI Refresh Keep Failing Overnight?
Scheduled refresh times out, Power Query runs out of memory, and you find out when someone opens the dashboard. The cause is almost never Power BI. It is what Power BI is being asked to do.