Is Your Power BI DirectQuery Report Slow on Every Click?
DirectQuery and Direct Lake promise live data. What you get is a thirty second visual and a compute bill nobody wants to explain. The mode is not the problem. The schema underneath it is.
The data warehouse automation platform trusted by data teams across industries









Does this sound familiar?
- Every filter click sends a fresh wave of queries and the visuals crawl.
- Synapse or Fabric compute costs jumped the month the dashboard went live.
- Direct Lake falls back to DirectQuery and nobody can tell you exactly why.
- The same report is fast in import mode, so you use import and lose the live data.
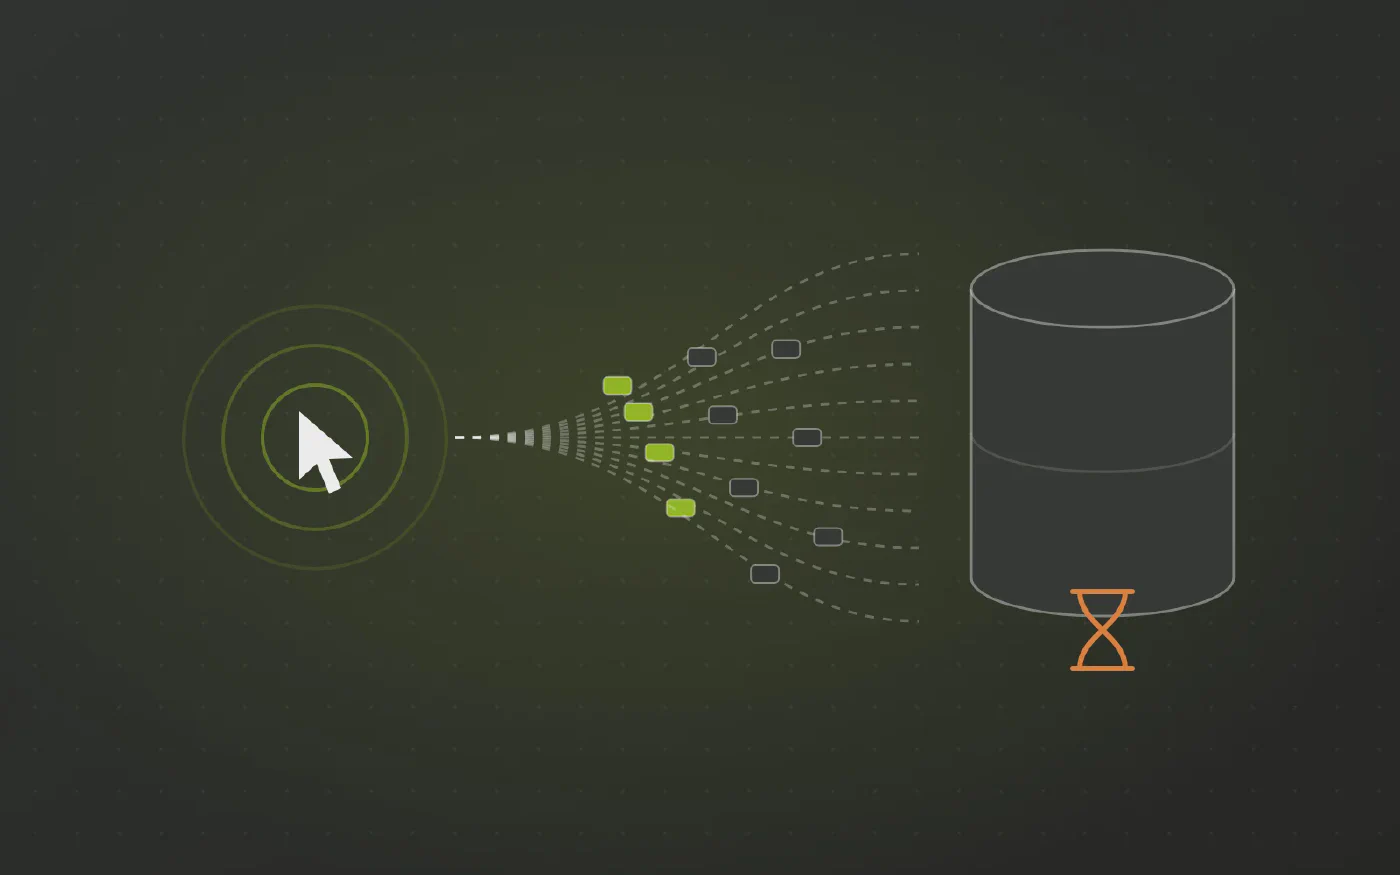
DirectQuery does exactly what it says: it turns every interaction into SQL against your database. Whether that is fast depends entirely on what it lands on.
What DirectQuery generates
- Against a star schema: one fact table, a few dimension joins on real keys. The database answers in milliseconds.
- Against 3NF or raw lake tables: deep nested joins across a dozen tables, rebuilt for every visual and every click.
- No push down to lean on. Un-partitioned, un-indexed tables mean a full scan each time.
- Fallback is silent. Direct Lake quietly reverts to DirectQuery when the source is not in the shape it needs, which is when the cost appears.
Multiply by visuals on the page, then by concurrent users. That is the bill.
Why it lands on you
- The warehouse exposed what it had, which is operational tables, not analytical ones.
- Import mode is the workaround, and it costs you the live data you chose DirectQuery for.
- You can tune visuals. You cannot re-partition the source.
The work is in the wrong place
- Shaping tables for analysis is warehouse work. DirectQuery cannot do it, so every click pays for the missing shape.
- It belongs in one central place: a data warehouse or data hub, built once and read by every report.
- If that sounds expensive, the estimate probably assumes hand built pipelines. A specialised automation platform generates them from a model, which changes both the cost and the time it takes.
What changes when the model arrives finished
Datavault Builder generates dimensional models natively in the target platform, materialised or virtualised, built for analytical push down rather than transactional access.
- One fact table, real dimensions. The generated SQL is short by construction.
- Partitioned and clustered on the columns people actually filter by.
- Direct Lake stays in Direct Lake, because the tables are already in the shape it wants.
- Compute drops because each click scans a lean model instead of the raw layer.
- Live data stops being a trade against speed.
What to ask for
“DirectQuery is joining across normalised tables on every click, so the compute cost scales with users. Can we expose a partitioned star schema for this report to query instead?”
Specific enough to scope, and it points at the layer where the fix belongs.
See It Working on Your Own Data
Book a free demo and bring the report that gives you the most trouble.
Three Steps to Numbers That Add Up
-
Extract the existing logic
Collect the calculations, joins and filters that live in your reports today.
-
Centralize it in one place
The logic moves into the warehouse model once, so every report reads the same definition.
-
Enjoy numbers that add up
Every report shows the same figure, and “where did this number come from” has a visible answer.
How Datavault Builder Hands Your Report a Finished Model
-
The model arrives finished
Datavault Builder generates the vault and the star schema to run natively in the database you already have: SQL Server, Azure SQL, Synapse, Fabric, Snowflake, Databricks or BigQuery.
-
The work leaves the report
No merge, no parsing, no fuzzy match. That work is gone from the report.
-
Sources arrive integrated
Customers from the ERP, the CRM and the web shop are matched into one set of conformed dimensions. The join happens once in the warehouse, not again in every report.
-
History you can query
Every change is retained as it arrives, so you can report as-was as well as as-is, even where the source system overwrites its own records.
-
Every number has lineage
The logic gains lineage, so “where did this number come from” has a visible answer.
-
Changes handled upstream
Slowly changing dimensions are handled upstream as vault satellites, not approximated.
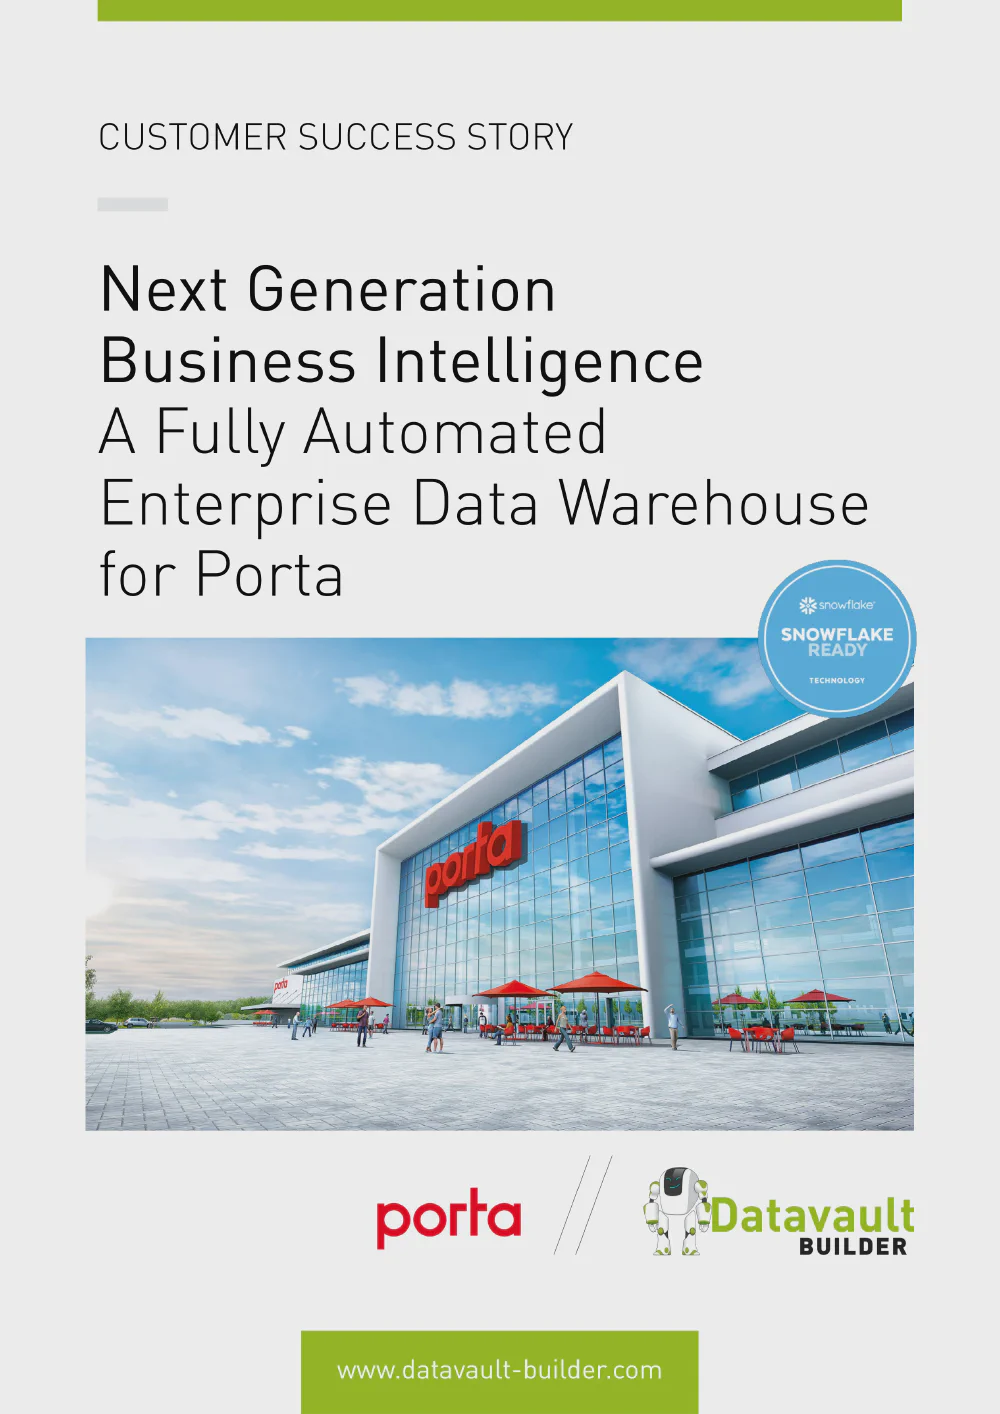
Customer Story: Porta
Recognized by BARC in The Data Fabric Survey 26
Meet Our Expert
Twenty minutes with our Sales Director, and an honest answer on whether this fits your situation.

Matt Collett
Sales Director
Great, pick a time that works for you:
Other Problems This Series Covers
-
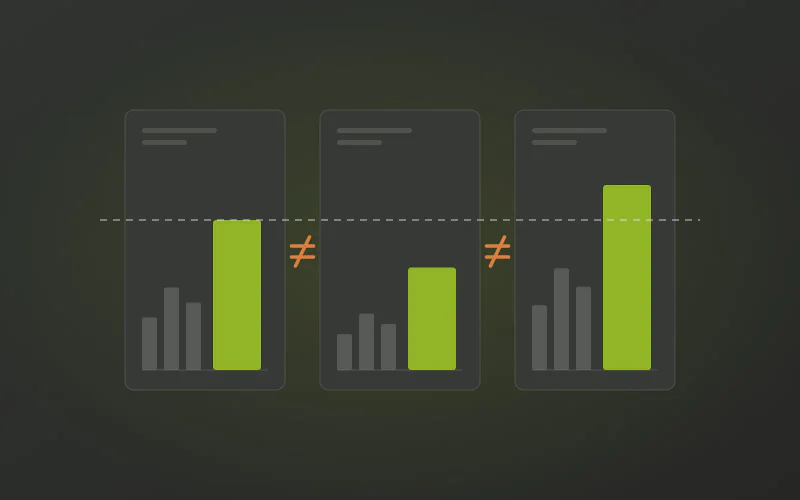
Do Your Power BI Reports Show Different Numbers for the Same Thing?
Finance, Sales and Operations each built their own semantic model, and each is internally consistent. The definitions were never wrong in one place. They were never agreed in any place.
-

Is Your Power BI DAX Getting Too Long to Maintain?
Two hundred lines of CALCULATE and FILTER is not a sign of advanced DAX. It is usually a sign that the warehouse never gave you the keys, the history or the grain you needed.
-

Does Your Power BI Refresh Keep Failing Overnight?
Scheduled refresh times out, Power Query runs out of memory, and you find out when someone opens the dashboard. The cause is almost never Power BI. It is what Power BI is being asked to do.