Is Your Tableau Dashboard Slow Every Time You Change a Filter?
Twenty seconds of "Executing Query" on every filter click. Tableau is not rendering slowly. It is waiting for a database that was handed a question it cannot answer quickly.
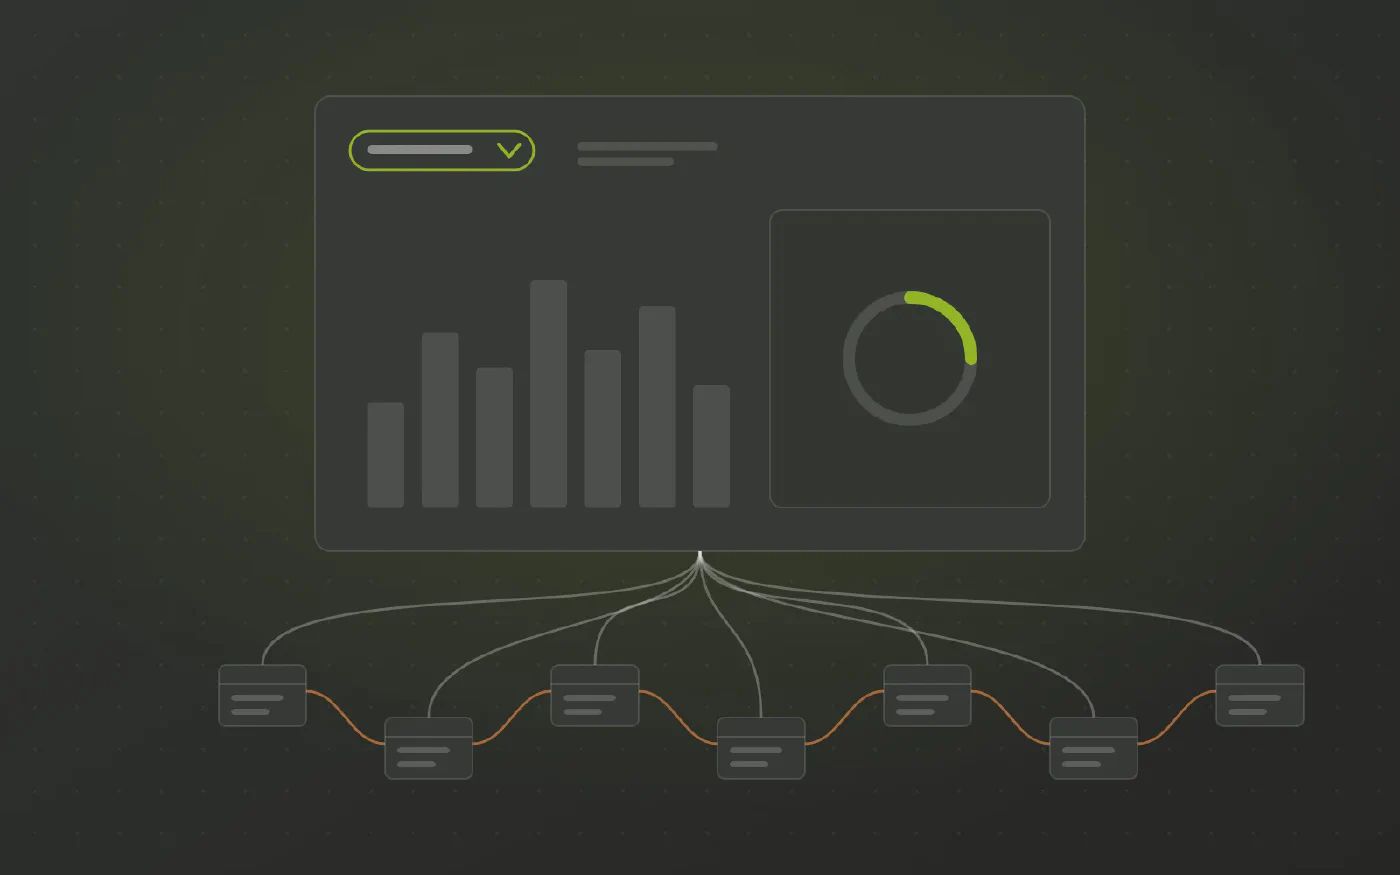
The data warehouse automation platform trusted by data teams across industries









Does this sound familiar?
- Changing one filter puts "Executing Query" on screen for twenty seconds or more.
- Performance recording shows almost all the time in query execution, barely any in rendering.
- The dashboard is fine with one quarter of data and unusable with three years.
- You have started hiding filters to stop people triggering the slow path.
Tableau is not the slow part. VizQL turns each interaction into SQL, and how long that takes depends entirely on the shape of what it queries.
What VizQL is being asked to do
- Against a star schema: one fact table, a few dimension joins on real keys. It returns in milliseconds.
- Against 3NF or raw tables: joins across a dozen tables, rebuilt on every mark, every filter, every user.
- Nothing to index against. Operational tables are indexed for transactions, not for the columns analysts group by.
- It compounds. Each worksheet on the dashboard issues its own query.
Why it lands on you
- The data source you were given is the one that existed, not one built for analysis.
- Custom SQL and blends were the way to make it work at all, and they make each query heavier.
- You can tune the workbook. You cannot re-model the source.
The work is in the wrong place
- Joining raw tables into something analysable is warehouse work. VizQL repeats it on every filter change.
- It belongs in one central place: a data warehouse or data hub, built once and read by every workbook.
- If that sounds expensive, the estimate probably assumes hand built pipelines. A specialised automation platform generates them from a model, which changes both the cost and the time it takes.
What changes when the model arrives finished
Datavault Builder generates facts and dimensions natively in Snowflake, Databricks, BigQuery, Synapse, SQL Server, Oracle, Exasol or PostgreSQL, built for analytical access.
- One fact table, conformed dimensions. VizQL emits short SQL by construction.
- Real keys, so joins are single column rather than multi field string matches.
- A single grain per table, which removes the duplicate rows that inflate scans.
- Live connections stay usable, so an extract is a choice rather than an escape.
- Filters respond fast enough that you can put them back on the dashboard.
What to ask for
“VizQL is joining across normalised tables on every filter click, so the query time scales with the data. Can we get a star schema for this dashboard to connect to instead of the operational tables?”
That names the mechanism and points at the layer where it can be fixed.
See It Working on Your Own Data
Book a free demo and bring the report that gives you the most trouble.
Three Steps to Numbers That Add Up
-
Extract the existing logic
Collect the calculations, joins and filters that live in your reports today.
-
Centralize it in one place
The logic moves into the warehouse model once, so every report reads the same definition.
-
Enjoy numbers that add up
Every report shows the same figure, and “where did this number come from” has a visible answer.
How Datavault Builder Hands Your Report a Finished Model
-
The model arrives finished
Datavault Builder generates the vault and the star schema to run natively in the database you already have: SQL Server, Azure SQL, Synapse, Fabric, Snowflake, Databricks or BigQuery.
-
The work leaves the report
No merge, no parsing, no fuzzy match. That work is gone from the report.
-
Sources arrive integrated
Customers from the ERP, the CRM and the web shop are matched into one set of conformed dimensions. The join happens once in the warehouse, not again in every report.
-
History you can query
Every change is retained as it arrives, so you can report as-was as well as as-is, even where the source system overwrites its own records.
-
Every number has lineage
The logic gains lineage, so “where did this number come from” has a visible answer.
-
Changes handled upstream
Slowly changing dimensions are handled upstream as vault satellites, not approximated.
Recognized by BARC in The Data Fabric Survey 26
Meet Our Expert
Twenty minutes with our Sales Director, and an honest answer on whether this fits your situation.

Matt Collett
Sales Director
Great, pick a time that works for you:
Other Problems This Series Covers
-

Does Your Tableau Server Have Too Many Versions of the Same Number?
Every published .tdsx was reasonable on the day it was made. Together they are hundreds of private definitions of the same metric, and no way to tell which one is right.
-

Are Your Tableau LOD Expressions Too Complex to Touch?
FIXED, INCLUDE and EXCLUDE are precise tools for genuine multi grain questions. Most of the ones in your workbook are there because the warehouse never resolved the grain or kept the history.
-
Do Your Tableau Extract Refreshes Keep Failing or Running Late?
The backgrounder times out, the .hyper file keeps growing, and the dashboard shows yesterday. The extract is large because it is carrying raw rows that were never aggregated upstream.