Are Your Qlik Set Analysis Expressions Too Long and Too Slow?
Set analysis is precise for genuine comparisons. Most of the long expressions in your app are there because the model never delivered history, flags or a single grain, so the chart rebuilds them on every selection.
The data warehouse automation platform trusted by data teams across industries









Does this sound familiar?
- One expression runs to several lines of nested set modifiers and Aggr calls.
- Charts show the calculating spinner after every selection.
- You are using set analysis to work out what a value was at a point in time.
- Only the person who wrote the master measure dares to change it.
Set analysis is the right tool for a genuine comparison, such as this year against last. It is also where the fix goes when the model is missing something, and that kind is what slows the app.
What the long expressions are standing in for
- History. Date modifiers and
Aggrreconstructing the state a record had last March. - Flags.
If()conditions inside the expression deciding what counts as active or valid, on every calculation. - Grain.
AggrandOnlyundoing duplication from a table that holds two grains at once. - Missing relationships. Nested modifiers such as
{<Year={2024}>}combined withP()doing what a proper dimension would.
Each is evaluated per chart, per selection, per user. That is the spinner.
Why it lands on you
- Every expression was the quickest way to a correct number that week.
- The logic lives inside the
.qvf, so nobody outside the app can review or reuse it. - You can simplify the expression. You cannot add the history the model never kept.
The work is in the wrong place
- History, flags and grain are warehouse work. In set analysis they are recalculated on every selection.
- It belongs in one central place: a data warehouse or data hub, built once and read by every app.
- If that sounds expensive, the estimate probably assumes hand built pipelines. A specialised automation platform generates them from a model, which changes both the cost and the time it takes.
What changes when the model arrives finished
Datavault Builder generates the vault and the star schema natively in the database you already use, including SQL Server, Azure SQL, Oracle, Snowflake and Databricks.
- History is kept as satellites, and point in time tables answer “as at March” with a join.
- Flags are columns, calculated once in the warehouse rather than inside every expression.
- One grain per fact table, which removes most of the
Aggrwork outright. - Conformed dimensions give set modifiers real fields to select on.
- What remains are genuine comparisons, short enough for a colleague to read.
What to ask for
Not “the dashboard is slow”, but:
“Our set analysis is rebuilding point in time state and status flags on every selection. Can the warehouse give us a point in time table and the flags as columns, so the expressions become plain sums?”
That separates the set analysis you actually need from the set analysis you are using as a patch.
See It Working on Your Own Data
Book a free demo and bring the report that gives you the most trouble.
Three Steps to Numbers That Add Up
-
Extract the existing logic
Collect the calculations, joins and filters that live in your reports today.
-
Centralize it in one place
The logic moves into the warehouse model once, so every report reads the same definition.
-
Enjoy numbers that add up
Every report shows the same figure, and “where did this number come from” has a visible answer.
How Datavault Builder Hands Your Report a Finished Model
-
The model arrives finished
Datavault Builder generates the vault and the star schema to run natively in the database you already have: SQL Server, Azure SQL, Synapse, Fabric, Snowflake, Databricks or BigQuery.
-
The work leaves the report
No merge, no parsing, no fuzzy match. That work is gone from the report.
-
Sources arrive integrated
Customers from the ERP, the CRM and the web shop are matched into one set of conformed dimensions. The join happens once in the warehouse, not again in every report.
-
History you can query
Every change is retained as it arrives, so you can report as-was as well as as-is, even where the source system overwrites its own records.
-
Every number has lineage
The logic gains lineage, so “where did this number come from” has a visible answer.
-
Changes handled upstream
Slowly changing dimensions are handled upstream as vault satellites, not approximated.
Recognized by BARC in The Data Fabric Survey 26
Meet Our Expert
Twenty minutes with our Sales Director, and an honest answer on whether this fits your situation.

Matt Collett
Sales Director
Great, pick a time that works for you:
Other Problems This Series Covers
-
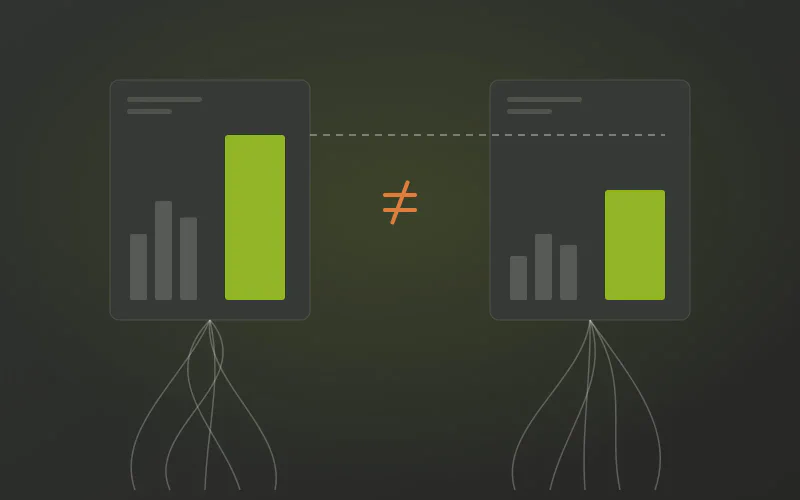
Do Your Qlik Apps and Power BI Reports Show Different Numbers?
Neither Qlik nor Power BI is wrong. Each has its own load logic, its own definitions and its own lineage, so the same metric is calculated twice and nobody can reconcile them. The rules belong in one governed warehouse model both tools read.
-
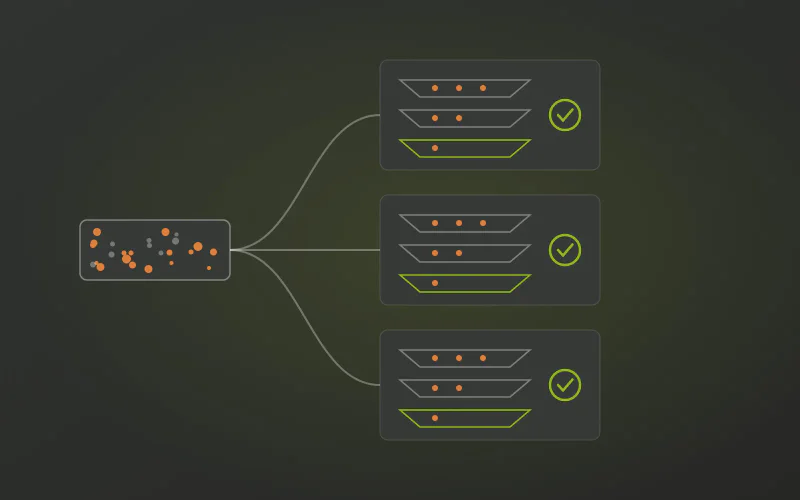
Do You Clean the Same Data Again in Every Qlik Load Script?
The same mapping loads, string fixes and deduplication are written again in every app and QVD layer, and the copies drift apart. The cleansing is repeated per script because no integrated warehouse layer does it once.
-
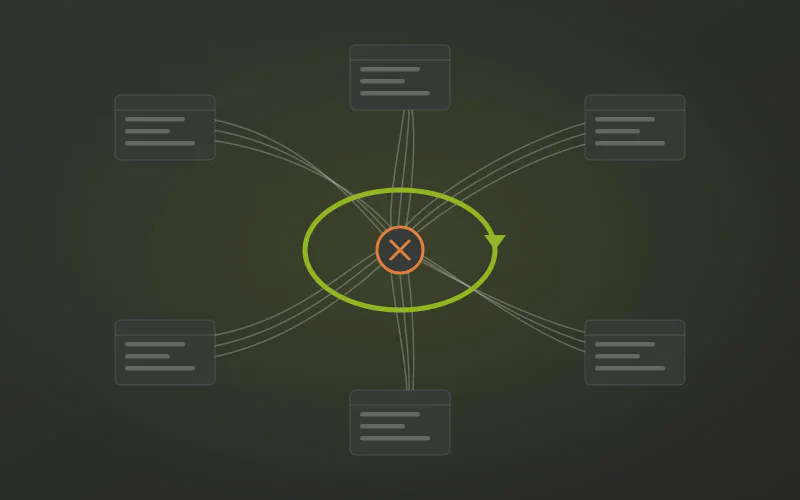
Do Your Qlik Apps Keep Creating Synthetic Keys?
Synthetic keys and circular references are Qlik associating exactly what it was given. They appear because the data arrives without conformed dimensions or real keys, so every app has to invent them.