Solutions to BI Tool Challenges
Your BI tool is rarely the problem. The data it is handed usually is. One article per symptom, per tool, written for the analyst who has to make the report work.
Every BI platform on this list is good at what it was built for. Power BI renders, Tableau tells stories, Looker pushes clean SQL down to the warehouse, Qlik lets you roam a model without a fixed path. What none of them was built to be is a transformation engine.
That is usually where the day goes. The refresh that fails at 03:00, the measure that grew to two hundred lines, the third version of “active customer” that nobody can reconcile: none of those are rendering problems. They are the shape of the data arriving at the tool.
This series takes one symptom at a time, explains what is actually causing it upstream, and shows what changes when the warehouse hands the tool a model it can use directly.
-
Qlik
Do Your Qlik Apps and Power BI Reports Show Different Numbers?
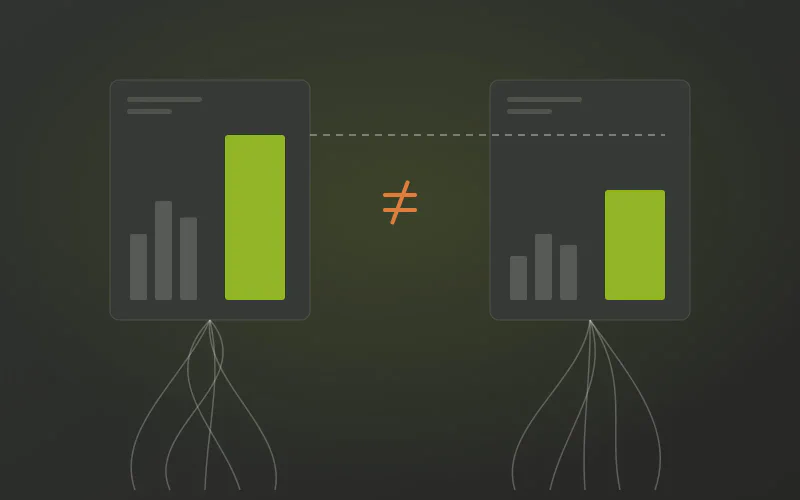
Neither Qlik nor Power BI is wrong. Each has its own load logic, its own definitions and its own lineage, so the same metric is calculated twice and nobody can reconcile them. The rules belong in one governed warehouse model both tools read.
Read more → -
Tableau
Does Your Tableau Server Have Too Many Versions of the Same Number?
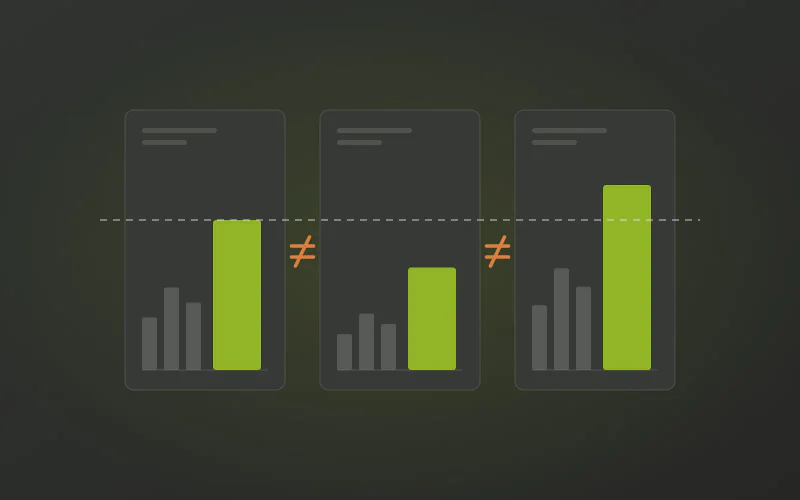
Every published .tdsx was reasonable on the day it was made. Together they are hundreds of private definitions of the same metric, and no way to tell which one is right.
Read more → -
Power BI
Do Your Power BI Reports Show Different Numbers for the Same Thing?
Finance, Sales and Operations each built their own semantic model, and each is internally consistent. The definitions were never wrong in one place. They were never agreed in any place.
Read more → -
Qlik
Do You Clean the Same Data Again in Every Qlik Load Script?
The same mapping loads, string fixes and deduplication are written again in every app and QVD layer, and the copies drift apart. The cleansing is repeated per script because no integrated warehouse layer does it once.
Read more → -
Qlik
Are Your Qlik Set Analysis Expressions Too Long and Too Slow?
Set analysis is precise for genuine comparisons. Most of the long expressions in your app are there because the model never delivered history, flags or a single grain, so the chart rebuilds them on every selection.
Read more → -
Tableau
Are Your Tableau LOD Expressions Too Complex to Touch?
FIXED, INCLUDE and EXCLUDE are precise tools for genuine multi grain questions. Most of the ones in your workbook are there because the warehouse never resolved the grain or kept the history.
Read more → -
Power BI
Is Your Power BI DirectQuery Report Slow on Every Click?
DirectQuery and Direct Lake promise live data. What you get is a thirty second visual and a compute bill nobody wants to explain. The mode is not the problem. The schema underneath it is.
Read more → -
Qlik
Do Your Qlik Apps Keep Creating Synthetic Keys?
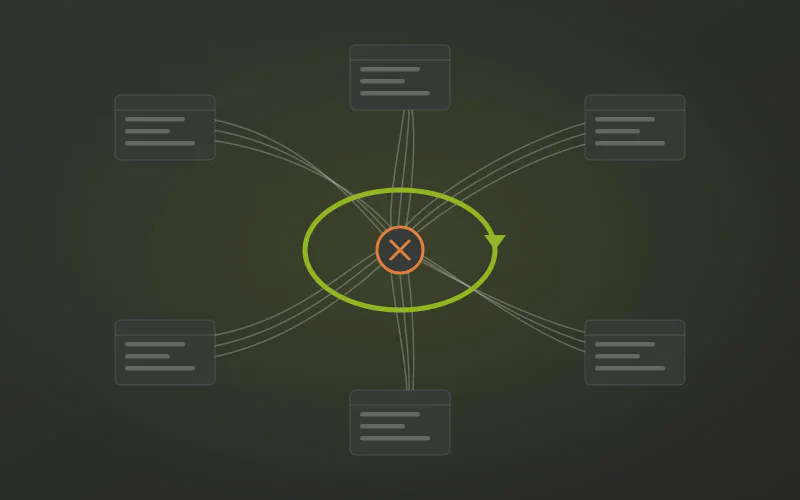
Synthetic keys and circular references are Qlik associating exactly what it was given. They appear because the data arrives without conformed dimensions or real keys, so every app has to invent them.
Read more → -
Qlik
Do Your Qlik Reloads Keep Failing as the Data Grows?
The in-memory engine is fast because everything sits in RAM. Reloads fail and apps slow down when that RAM is filled with row level detail and transformations that no warehouse did beforehand.
Read more → -
Tableau
Do Your Tableau Extract Refreshes Keep Failing or Running Late?
The backgrounder times out, the .hyper file keeps growing, and the dashboard shows yesterday. The extract is large because it is carrying raw rows that were never aggregated upstream.
Read more → -
Power BI
Is Your Power BI DAX Getting Too Long to Maintain?
Two hundred lines of CALCULATE and FILTER is not a sign of advanced DAX. It is usually a sign that the warehouse never gave you the keys, the history or the grain you needed.
Read more → -
Tableau
Is Your Tableau Dashboard Slow Every Time You Change a Filter?
Twenty seconds of "Executing Query" on every filter click. Tableau is not rendering slowly. It is waiting for a database that was handed a question it cannot answer quickly.
Read more → -
Power BI
Does Your Power BI Refresh Keep Failing Overnight?
Scheduled refresh times out, Power Query runs out of memory, and you find out when someone opens the dashboard. The cause is almost never Power BI. It is what Power BI is being asked to do.
Read more →








Nothing here yet.